Introduction
This data set aimed at providing a general view on the development of aviation industry within Asia-Pacific Economic Cooperation (APEC) in the past decade. This data hope to serve as a platform to introduce the recent development of the fast-growing aviation industry in APEC to the public, as well as to provide the basic information and inspiration for academic purpose and policy making.
The annual data from 2005 to 2019 are collected from government departments and airport operating corporations (for further information, please check the sheet “Sources”). Nearly 50 major airports from APEC member economies are investigated in terms of their number of passengers, volume of cargo and number of flights.*
Description of parameters
Parameters of measuring the performance of each airport are selected to provide a quick understanding on the development of aviation industry. To have a more profound research, which is not the main purpose of this data set, one must conduct further research on other factors.
Number of passengers
The number of passengers measures the number of people carried by aircrafts. It includes the passengers choosing the specific airport as a spot to make arrivals, departures, and transitions. It depicts, to a certain extent, the degree of air connectivity of each selected city to the rest of the world. The differences among airports may be affected by the development of tourism, market position determined for the airport, domestic economic activities, etc.
Volume of cargo
The volume of cargo measures the weight of cargo (in tons) carried by aircrafts. It includes the cargo loaded and discharged within the airport. The differences of it among airports show the exporting and importing activities through air transport, which may be affected by international free trade agreements, domestic economic activities and local infrastructure development.
Number of flights
The number of flights is directly linked to the operation of airports and airline, serving as one of the most important indicators of the aviation industry. It may be affected by the demand of air traffic, demand for cargo transportation, capacity of airports, etc.
Examples
Generally, our data shows that the aviation industry in APEC has been growing fast in recent years. The followings are only two examples of observations one could draw from the data.
1. Beijing and Hong Kong
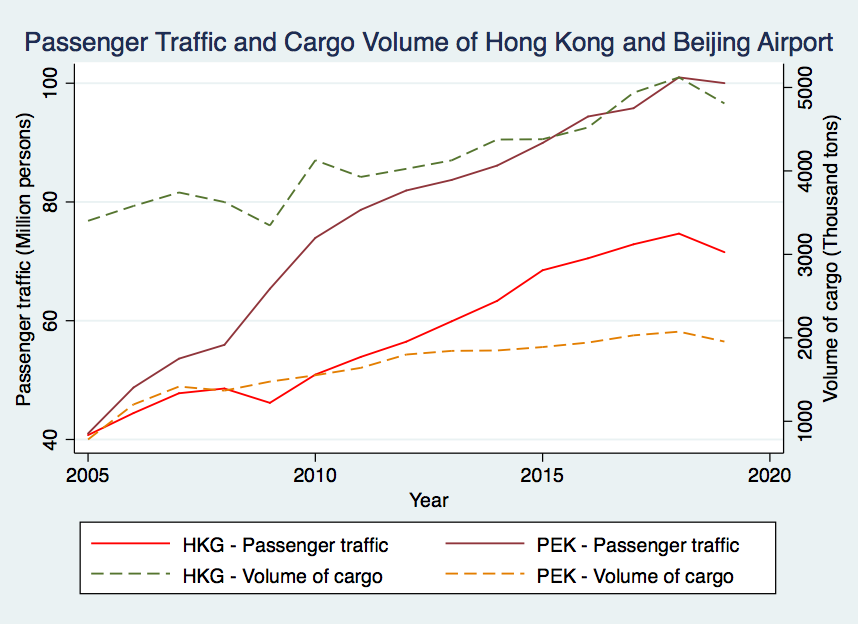
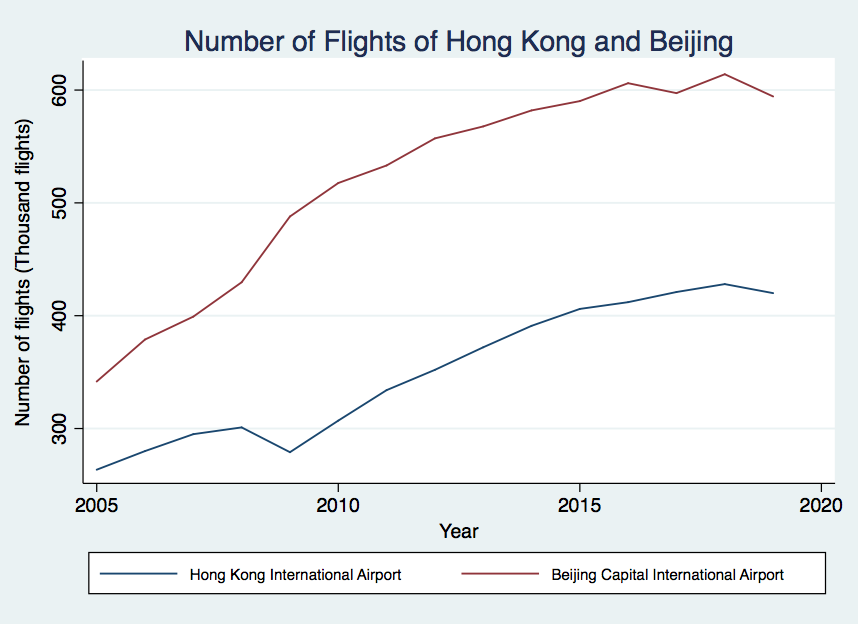
See Figure 1 and 2. Hong Kong International Airport and Beijing Capital International Airport have significant growth in all the parameters. Both the number of passengers and flights in Hong Kong increased for around 70% from 2005 to 2019 while the volume of cargo raised by 40% to around 5 million tons. As for Beijing, both the number of passengers and volume of cargo rocketed by 150% in the same period of time, and flights going to/from it increased by 70%.
2. Malaysia
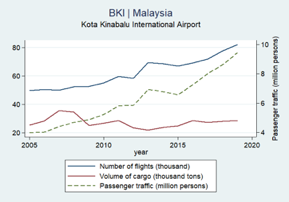
Another trend observed is that the number of flights shows a more direct and significant relationship with the passenger traffic, rather than the cargo volume. For Kota Kinabalu International airport in Malaysia (Figure 3), number of flights and number of passengers had at least doubled from 2005 to 2019 while the volume of cargo only grew by 3000 tons. It maybe associates to the market positioning of the airport that this airport mainly serves travellers instead of trading activities.
Database
The data can be downloaded in the link below:
https://drive.google.com/file/d/1iMCAU6ZR97KU14vM34HHSTpYjfcm8T3M/view?usp=sharing
* There are some missing data due to languages issue, outdated government records and availability of past data in some countries.